It's Greek to me
Β - beta
η - eta
ξ - xi
ζ - zeta
Γ - gamma
Λ - lambda (upper case)
λ - lambda (lower case)
δ - delta
ε - epsilon
Structural Equation Model
The structural model is a regression model with exogenous and endogenous latent variables. These latent variables can be thought of as factors.
Notation
Measurement Model
The measure model involves the use of confirmatory factor analysis.
Notation
Example with Full Notation
In Mplus the above model would be written as follows:
MODEL:
* measurement model/confirmatory factor analysis
  xi1  by   x1 x2 x3;
  xi2  by   x4 x5;
  eta1 by   y1 y2;
  eta2 by   y2 y3 y4;

* structural model
  xi1  with xi2;
  eta1 on   xi1;
  eta2 on   xi2 eta1;
SEM Example with Output
INPUT INSTRUCTIONS
TITLE: cont3
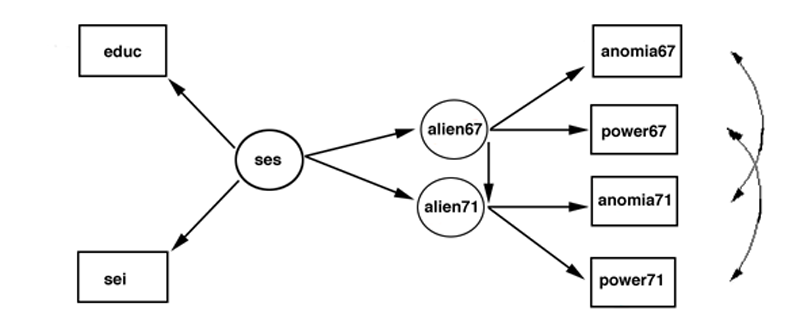
Classic structural equation model with multiple indicators
used in a study of the stability of alienation.
DATA: FILE IS wheacov.dat;
TYPE IS COVARIANCE;
NOBS ARE 932;
VARIABLE: NAMES ARE anomia67 power67 anomia71 power71 educ sei;
USEVAR = anomia67 power67 anomia71 power71 educ sei;
MODEL:
! first the measurement model part using the keyword BY:
ses BY educ sei;
alien67 BY anomia67 power67;
alien71 BY anomia71 power71;
! next the structural model part using the keyword ON:
alien71 ON alien67 ses;
alien67 ON ses;
! and then adding correlated residuals over time using
! the keyword WITH:
anomia67 WITH anomia71;
power67 WITH power71;
OUTPUT:
standardized;
INPUT READING TERMINATED NORMALLY
SUMMARY OF ANALYSIS
Number of groups 1
Number of observations 932
Number of dependent variables 6
Number of independent variables 0
Number of continuous latent variables 3
Observed dependent variables
Continuous
ANOMIA67 POWER67 ANOMIA71 POWER71 EDUC SEI
Continuous latent variables
SES ALIEN67 ALIEN71
Estimator ML
Information matrix EXPECTED
Maximum number of iterations 1000
Convergence criterion 0.500D-04
Maximum number of steepest descent iterations 20
Input data file(s)
wheacov.dat
Input data format FREE
THE MODEL ESTIMATION TERMINATED NORMALLY
TESTS OF MODEL FIT
Chi-Square Test of Model Fit
Value 4.771
Degrees of Freedom 4
P-Value 0.3116
Chi-Square Test of Model Fit for the Baseline Model
Value 2133.794
Degrees of Freedom 15
P-Value 0.0000
CFI/TLI
CFI 1.000
TLI 0.999
Loglikelihood
H0 Value -15213.256
H1 Value -15210.870
Information Criteria
Number of Free Parameters 17
Akaike (AIC) 30460.511
Bayesian (BIC) 30542.746
Sample-Size Adjusted BIC 30488.755
(n* = (n + 2) / 24)
RMSEA (Root Mean Square Error Of Approximation)
Estimate 0.014
90 Percent C.I. 0.000 0.053
Probability RMSEA <= .05 0.928
SRMR (Standardized Root Mean Square Residual)
Value 0.007
MODEL RESULTS
Estimates S.E. Est./S.E. Std StdYX
SES BY
EDUC 1.000 0.000 0.000 2.607 0.841
SEI 5.221 0.422 12.367 13.611 0.642
ALIEN67 BY
ANOMIA67 1.000 0.000 0.000 2.663 0.775
POWER67 0.979 0.062 15.896 2.606 0.852
ALIEN71 BY
ANOMIA71 1.000 0.000 0.000 2.850 0.806
POWER71 0.922 0.059 15.501 2.627 0.832
ALIEN71 ON
ALIEN67 0.607 0.051 11.895 0.567 0.567
SES -0.227 0.052 -4.337 -0.208 -0.208
ALIEN67 ON
SES -0.575 0.056 -10.197 -0.563 -0.563
ANOMIA67 WITH
ANOMIA71 1.622 0.314 5.173 1.622 0.133
POWER67 WITH
POWER71 0.340 0.261 1.302 0.340 0.035
Variances
SES 6.796 0.649 10.476 1.000 1.000
Residual Variances
ANOMIA67 4.730 0.453 10.438 4.730 0.400
POWER67 2.564 0.403 6.363 2.564 0.274
ANOMIA71 4.397 0.515 8.537 4.397 0.351
POWER71 3.072 0.434 7.078 3.072 0.308
EDUC 2.804 0.507 5.532 2.804 0.292
SEI 264.537 18.125 14.595 264.537 0.588
ALIEN67 4.842 0.467 10.359 0.683 0.683
ALIEN71 4.084 0.404 10.104 0.503 0.503
R-SQUARE
Observed
Variable R-Square
ANOMIA67 0.600
POWER67 0.726
ANOMIA71 0.649
POWER71 0.692
EDUC 0.708
SEI 0.412
Latent
Variable R-Square
ALIEN67 0.317
ALIEN71 0.497
Multivariate Course Page
Phil Ender, 30nov05, 19Feb98