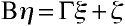
It's Greek to me
Β - beta
η - eta
ξ - xi
ζ - zeta
Γ - gamma
Λ - lambda (upper case)
λ - lambda (lower case)
δ - delta
ε - epsilon
Structural Equation Modeling
Structural Equation Model
Notation
Measurement Model
Notation
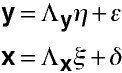
Example with Full Notation
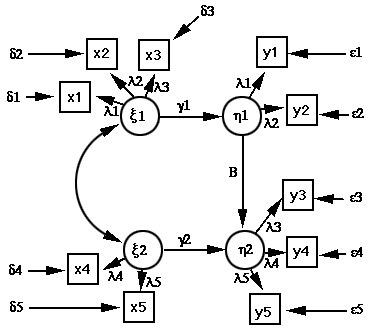
Example: Just Identified Model
Output: Just Identified Model
This is the same example as used in the path analysis unit with variables: x1-ξ1-ses, x2-ξ2-iq, y1-η1-am and y2-η2-gpa.
Mplus ESTIMATES

Mplus VERSION 2.02

INPUT INSTRUCTIONS

  TITLE:
    path analysis;

  DATA:
    FILE IS ..\data\ped.dat;

   VARIABLE:
            NAMES ARE ses iq am gpa;
            USEVAR = ses iq am gpa;

  ANALYSIS: TYPE=meanstructure;

  MODEL:
       iq on ses;
       am on ses iq;
       gpa on am ses iq;

  OUTPUT: sampstat residual;

           Correlations
              IQ            AM            GPA           SES
              ________      ________      ________      ________
 IQ             1.000
 AM             0.160         1.000
 GPA            0.570         0.500         1.000
 SES            0.300         0.410         0.330         1.000

TESTS OF MODEL FIT

Chi-Square Test of Model Fit
          Value                              0.000
          Degrees of Freedom                     0
          P-Value                           0.0000

Chi-Square Test of Model Fit for the Baseline Model
          Value                            289.885
          Degrees of Freedom                     6
          P-Value                           0.0000

CFI/TLI
          CFI                                1.000
          TLI                                1.000

Loglikelihood
          H0 Value                       -1555.780
          H1 Value                       -1555.780

Information Criteria
          Number of Free Parameters             12
          Akaike (AIC)                    3135.561
          Bayesian (BIC)                  3180.006
          Sample-Size Adjusted BIC        3141.949
            (n* = (n + 2) / 24)

RMSEA (Root Mean Square Error Of Approximation)
          Estimate                           0.000
          90 Percent C.I.                    0.000  0.000
          Probability RMSEA <= .05           0.000

SRMR (Standardized Root Mean Square Residual)
          Value                              0.000

MODEL RESULTS

                   Estimates     S.E.  Est./S.E.
 IQ       ON
    SES                0.300    0.055      5.447
 AM       ON
    SES                0.398    0.055      7.213
    IQ                 0.041    0.055      0.737
 GPA      ON
    AM                 0.416    0.045      9.256
    SES                0.009    0.047      0.198
    IQ                 0.501    0.043     11.647

 Residual Variances
    IQ                 0.907    0.074     12.247
    AM                 0.828    0.068     12.247
    GPA                0.502    0.041     12.247

 Intercepts
    IQ                 0.000    0.055      0.000
    AM                 0.000    0.053      0.000
    GPA                0.000    0.041      0.000


RESIDUAL OUTPUT


     ESTIMATED MODEL AND RESIDUALS (OBSERVED - ESTIMATED)

           Model Estimated Covariances/Correlations/Residual Correlations
              IQ            AM            GPA           SES
              ________      ________      ________      ________
 IQ             0.997
 AM             0.159         0.997
 GPA            0.568         0.498         0.997
 SES            0.299         0.409         0.329         0.997

LISREL ESTIMATES

BETA
           ETA1           ETA2
EQ 1       1.000          0.000
EQ 2      -0.416          1.000

GAMMA
           KSI1           KSI2
EQ 1       0.398          0.041
EQ 2       0.009          0.501
PHI
           KSI1           KSI2
KSI1       1.000
KSI2       0.300          1.000

PSI
           EQ1            EQ2
1          0.830          0.504

TEST OF GOODNESS OF FIT
CHI SQUARE WITH 0 DF = 0.00
PROBABILITY LEVEL = 1.000
Example: Overidentified Model
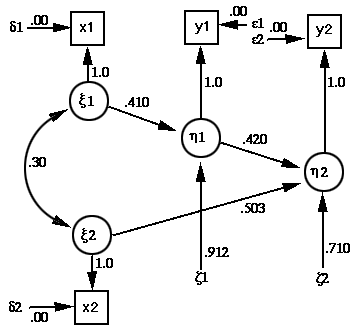
Output: Overidentified Model
Mplus ESTIMATES

TESTS OF MODEL FIT

Chi-Square Test of Model Fit
          Value                              0.582
          Degrees of Freedom                     2
          P-Value                           0.7469

Chi-Square Test of Model Fit for the Baseline Model
          Value                            289.885
          Degrees of Freedom                     6
          P-Value                           0.0000

CFI/TLI
          CFI                                1.000
          TLI                                1.015

Loglikelihood
          H0 Value                       -1556.071
          H1 Value                       -1555.780

Information Criteria
          Number of Free Parameters             10
          Akaike (AIC)                    3132.143
          Bayesian (BIC)                  3169.181
          Sample-Size Adjusted BIC        3137.467
            (n* = (n + 2) / 24)

RMSEA (Root Mean Square Error Of Approximation)
          Estimate                           0.000
          90 Percent C.I.                    0.000  0.079
          Probability RMSEA <= .05           0.868

SRMR (Standardized Root Mean Square Residual)
          Value                              0.013


MODEL RESULTS

                   Estimates     S.E.  Est./S.E.
 IQ       ON
    SES                0.300    0.055      5.447
 AM       ON
    SES                0.410    0.053      7.786
 GPA      ON
    AM                 0.420    0.041     10.162
    IQ                 0.503    0.041     12.180

 Residual Variances
    IQ                 0.907    0.074     12.247
    AM                 0.829    0.068     12.247
    GPA                0.502    0.041     12.247

 Intercepts
    IQ                 0.000    0.055      0.000
    AM                 0.000    0.053      0.000
    GPA                0.000    0.041      0.000


RESIDUAL OUTPUT


     ESTIMATED MODEL AND RESIDUALS (OBSERVED - ESTIMATED)

           Model Estimated Covariances/Correlations/Residual Correlations
              IQ            AM            GPA           SES
              ________      ________      ________      ________
 IQ             0.997
 AM             0.123         0.997
 GPA            0.553         0.480         0.981
 SES            0.299         0.409         0.322         0.997

LISREL ESTIMATES

BETA
           ETA1           ETA2
EQ 1       1.000          0.000
EQ 2      -0.420          1.000

GAMMA
           KSI1           KSI2
EQ 1       0.410          0.000
EQ 2       0.000          0.503
PHI
           KSI1           KSI2
KSI1       1.000
KSI2       0.300          1.000

PSI
           EQ1            EQ2
1          0.832          0.504

TEST OF GOODNESS OF FIT
CHI SQUARE WITH 2 DF = 0.1921
PROBABILITY LEVEL = 0.9084