
Example
use http://www.philender/com/courses/data/hsbdemo, clear

regress write read math science

      Source |       SS       df       MS              Number of obs =     200
-------------+------------------------------           F(  3,   196) =   57.30
       Model |  8353.98999     3  2784.66333           Prob > F      =  0.0000
    Residual |  9524.88501   196  48.5963521           R-squared     =  0.4673
-------------+------------------------------           Adj R-squared =  0.4591
       Total |   17878.875   199   89.843593           Root MSE      =  6.9711

------------------------------------------------------------------------------
       write |      Coef.   Std. Err.      t    P>|t|     [95% Conf. Interval]
-------------+----------------------------------------------------------------
        read |   .2356606   .0691053     3.41   0.001     .0993751    .3719461
        math |   .3194791   .0756752     4.22   0.000     .1702369    .4687213
     science |   .2016571   .0690962     2.92   0.004     .0653896    .3379246
       _cons |   13.19155   3.068867     4.30   0.000     7.139308    19.24378
------------------------------------------------------------------------------
Interpretation_cons = 13.19155 -- The predicted value when all of the predictors equal zero.
_b[read] = .2356606 -- For every one unit increase in read, the predicted value for write increases by .2356606 when all other variable in the model are held constant.
_b[math] = .3194791 -- For every one unit increase in math, the predicted value for write increases by .3194791 when all other variable in the model are held constant.
_b[science] = .2016571 -- For every one unit increase in science, the predicted value for write increases by .2016571 when all other variable in the model are held constant.
Conditional Expectation
In the multiple regression model we can write the conditional expectation as E(y | x1, x2), which indicates that we are interested in in the effect of variable x1 on the expected value of y while holding the variable x2 constant.
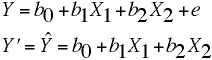
Regression Equation
Prediction Equation
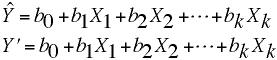
The Two Predictor Case
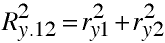
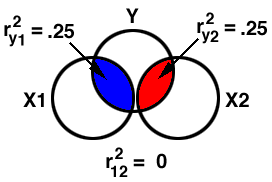
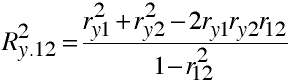
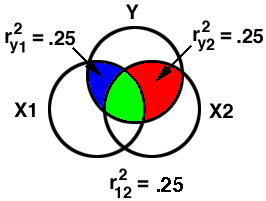
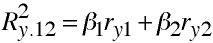
Squared Multiple Correlation
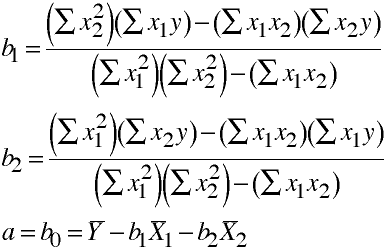
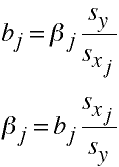
Regression Coefficients
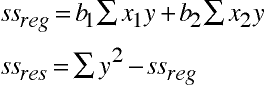
Sums of Squares
Raw Regression Coefficient vs Standardized Regression Coefficient
b vs β
Note
Prediction Equation in Standardized Form
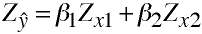
Beta Coefficients
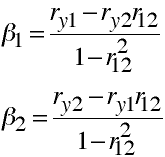
More on Betas
More on Squared Multiple Correlations
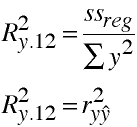
Even More Squared Multiple Correlation
Variance of Estimate/Standard Error of Estimate
The variance of estimate is also called the mean square error in the ANOVA summary table of the regression analysis.
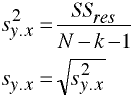
The standard error of estimate gives an indicatin of how far, on the average, observations fall from the regression line.
Testing the Model
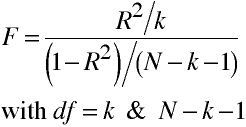
The Overall F-test
Interpreting Regression Coefficients
Interpreting Standardized Regression Coefficients (Betas)
Tests of Regression Coefficients
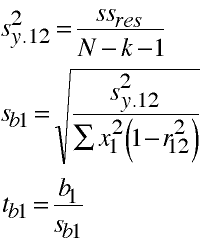
About Tests of Regression Coefficients
Note:
Comparing Variables
Interpreting R2
R2 has several interpretations:
                   R2/k
         F = ----------------
             (1 - R2)/(N-k-1)