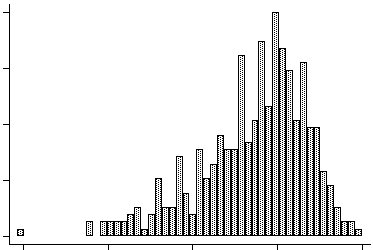
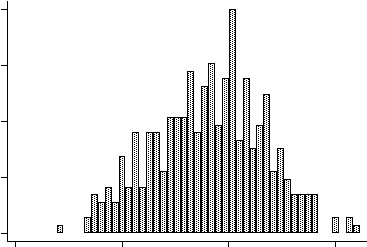
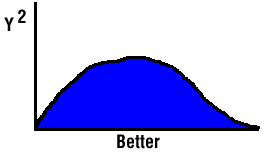
Transformations May be Necessary Due to:
- Theoretical considerations.
- Dependent variable may have a probability distribution in which the mean is related to the variance.
- Empirical evidence from examination of the residuals.
Variables to be Transformed
- The dependent variable can be transformed. Note: This effects the relationship of the dependent variable with all of the predictor variables in the model.
- Individual predictor variables can be transformed.
- Both dependent and independent variables can be transformed
Major Drawbacks
- Interpretation of the regression involves transformed variables and not the original variables themselves.
- Relationship of the transformed variables to the original variables may be difficult or confusing.
- Transformation may not be able to rectify all of the problems in the original data; the regression analysis may still be suspect.
Log Transformation

1. To linearize regression model with consistently increasing slope.
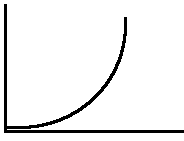
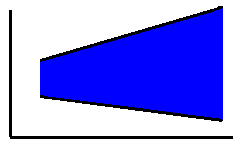
2. Stabilize variance when variance of residuals increases markedly with increasing Y.
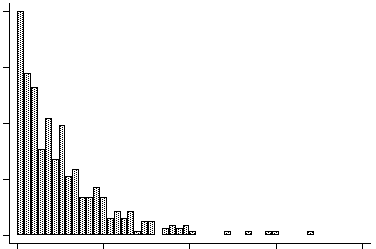
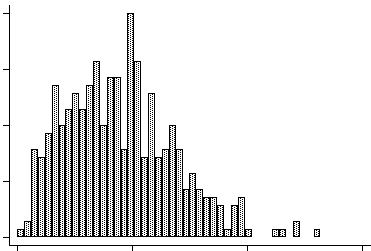
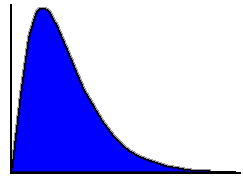
3. To normalize Y when distribution of residuals is positively skewed.
Stata Example
use http://www.philender.com/courses/data/lntrans, clear scatter y x, msym(oh) jitter(1)Square Root (SQRT) Transformationgenerate z = log(y) scatter z x, msym(oh) jitter(1)
regress z x Source | SS df MS Number of obs = 50 ---------+------------------------------ F( 1, 48) = 2916.35 Model | 365.874096 1 365.874096 Prob > F = 0.0000 Residual | 6.02190025 48 .125456255 R-squared = 0.9838 ---------+------------------------------ Adj R-squared = 0.9835 Total | 371.895996 49 7.58971421 Root MSE = .3542 ------------------------------------------------------------------------------ z | Coef. Std. Err. t P>|t| [95% Conf. Interval] ---------+-------------------------------------------------------------------- x | .9417895 .0174395 54.003 0.000 .906725 .976854 _cons | .906511 .1082093 8.377 0.000 .6889417 1.12408 ------------------------------------------------------------------------------ predict p twoway (scatter z x, msym(oh) jitter(1))(line p x)
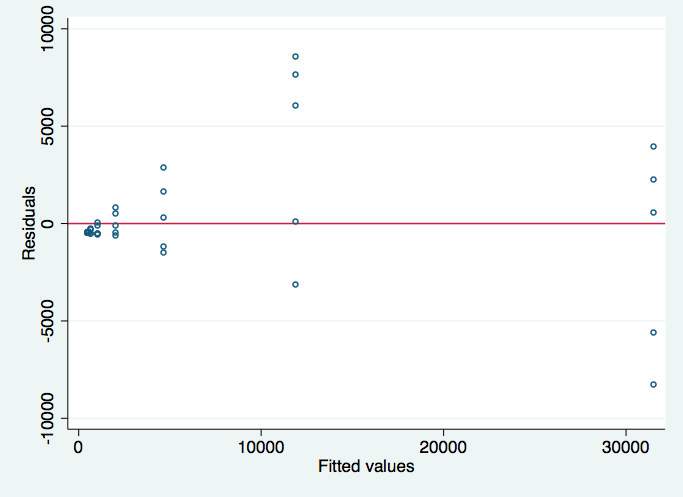
generate p2 = exp(p) twoway (scatter y x, msym(oh) jitter(1))(line p2 x) Source | SS df MS Number of obs = 50 ---------+------------------------------ F( 1, 48) = 650.09 Model | 4.3685e+09 1 4.3685e+09 Prob > F = 0.0000 Residual | 322552812 48 6719850.24 R-squared = 0.9312 ---------+------------------------------ Adj R-squared = 0.9298 Total | 4.6911e+09 49 95736235.2 Root MSE = 2592.3 ------------------------------------------------------------------------------ y | Coef. Std. Err. t P>|t| [95% Conf. Interval] ---------+-------------------------------------------------------------------- xt | 1.409637 .0552866 25.497 0.000 1.298476 1.520799 _cons | 493.3881 414.134 1.191 0.239 -339.284 1326.06 ------------------------------------------------------------------------------ rvfplot, yline(0) msym(oh)/* now transform x instead of y */ generate xt = exp(x) scatter y xt, msym(oh) jitter(1)
regress y xt

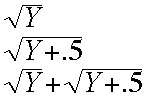
Used to stabilize variance when proportional to the mean of Y; especially when Y approximates a Poisson distribution.
Reciprocal Transformation

To stabilize variance when proportional to the 4th power of mean of Y, i.e., huge increase in variance above some threshold of Y. Purpose is to mimnimize effect of large values of Y. Transformed large Ys will be close to zero, thus large increases in Y will result in only trivial decreases in Y'.
Square Transformation

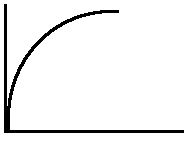
1. Linearize when X vs Y is curvilinear downward, i.e., slope decreases as X increases..
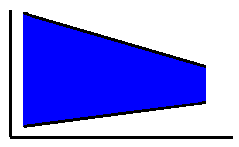
2. Stabilize variance when it decreases with the mean of Y.
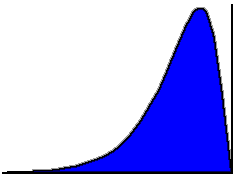
3. Normalize Y when distribution of residuals is negatively skewed.
Arcsin-Root Transformation

Stabilize variance when Y is a proportion or a rate
Poisson Distribution
-
Possible transformations:
