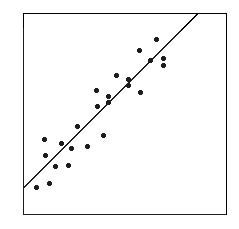
In simple linear regression there is only one predictor variable and takes the form y = b0 + b1x + e. Where y is the response variable, x the predictor variable and e the error or residual. Other terms for the predictor variable include independent variable, explanitory variable or right-hand variable. The response variable is also know as the dependent variable, criterion variable, outcome variable or left-hand variable.
Simple Linear Regression Output
use http://www.philender.com/courses/data/hsbdemo, clear

regress write read

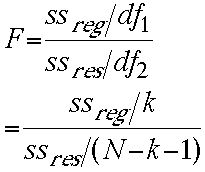
      Source |       SS       df       MS              Number of obs =     200
-------------+------------------------------           F(  1,   198) =  109.52
       Model |  6367.42127     1  6367.42127           Prob > F      =  0.0000
    Residual |  11511.4537   198  58.1386552           R-squared     =  0.3561
-------------+------------------------------           Adj R-squared =  0.3529
       Total |   17878.875   199   89.843593           Root MSE      =  7.6249

------------------------------------------------------------------------------
       write |      Coef.   Std. Err.      t    P>|t|     [95% Conf. Interval]
-------------+----------------------------------------------------------------
        read |   .5517051   .0527178    10.47   0.000     .4477446    .6556656
       _cons |   23.95944   2.805744     8.54   0.000     18.42647    29.49242
------------------------------------------------------------------------------
Interpretation_cons = 23.95944 -- The predicted value for observation when read scores equal zero.
_b[read] = .5517051 -- For every one unit increase in read, the predicted value for write increases by .5517051.
regress, beta

      Source |       SS       df       MS              Number of obs =     200
-------------+------------------------------           F(  1,   198) =  109.52
       Model |  6367.42127     1  6367.42127           Prob > F      =  0.0000
    Residual |  11511.4537   198  58.1386552           R-squared     =  0.3561
-------------+------------------------------           Adj R-squared =  0.3529
       Total |   17878.875   199   89.843593           Root MSE      =  7.6249

------------------------------------------------------------------------------
       write |      Coef.   Std. Err.      t    P>|t|                     Beta
-------------+----------------------------------------------------------------
        read |   .5517051   .0527178    10.47   0.000                 .5967765
       _cons |   23.95944   2.805744     8.54   0.000                        .
------------------------------------------------------------------------------
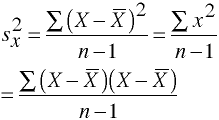
Variance


where:
Yi is the value of the dependent, response or outcome variable for the ith case
β0 and β1 are parameters
Xi is the value of the predictor, independent or explanitory variable for the ith case
εi is a random eror term with:
 or
or 
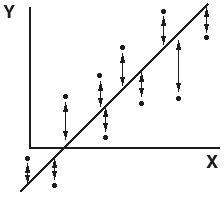

Squared Correlation Coefficient
aka -- Coefficient of Determintion

Coefficient of Alienation

Residual


Alternative formula

 �
�

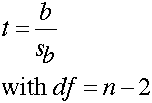
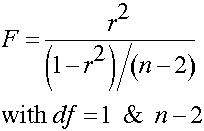

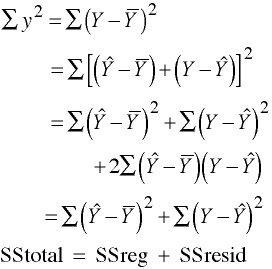
Sums of Squares Regression
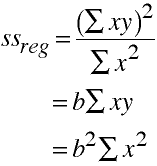
alternatively


