Linear Statistical Models: Regression
Index Plots
indexplot
Index plots can provide a quick way to scan large amounts of data to look unusual or aberent
observations. The indexplot command by Nick Cox is flexible and easy to use. You can
locate the command by typing findit modeldiag.
use http://www.philender.com/courses/data/crime, clear
regress crime pctmetro poverty single
Source | SS df MS Number of obs = 51
-------------+------------------------------ F( 3, 47) = 82.16
Model | 8170480.21 3 2723493.40 Prob > F = 0.0000
Residual | 1557994.53 47 33148.8199 R-squared = 0.8399
-------------+------------------------------ Adj R-squared = 0.8296
Total | 9728474.75 50 194569.495 Root MSE = 182.07
------------------------------------------------------------------------------
crime | Coef. Std. Err. t P>|t| [95% Conf. Interval]
-------------+----------------------------------------------------------------
pctmetro | 7.828935 1.254699 6.24 0.000 5.304806 10.35306
poverty | 17.68024 6.94093 2.55 0.014 3.716893 31.64359
single | 132.4081 15.50322 8.54 0.000 101.2196 163.5965
_cons | -1666.436 147.852 -11.27 0.000 -1963.876 -1368.996
------------------------------------------------------------------------------
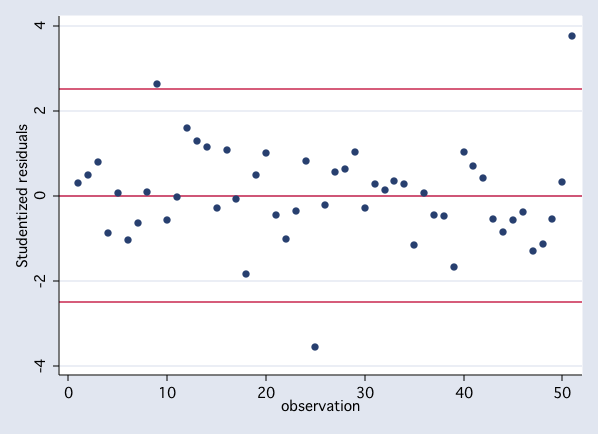
indexplot, show(rstu) recast(scatter) yline(2.5 -2.5)
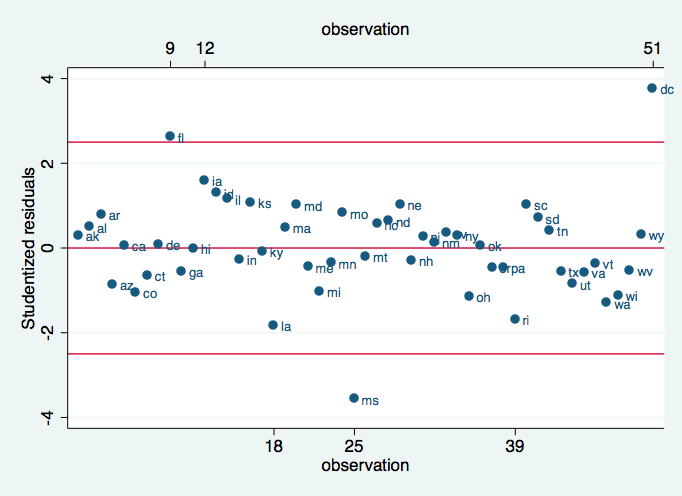
 indexplot, show(rstu) recast(scatter) hig(3) low(3) yline(-2.5 2.5) mlabel(state)
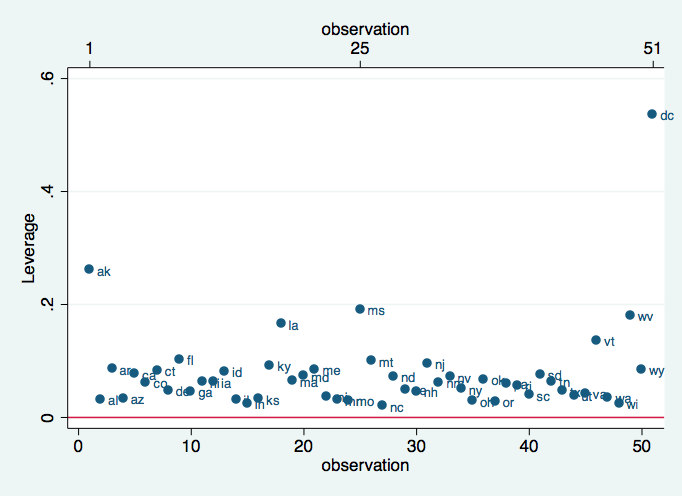
 indexplot, show(leverage) recast(scatter) hig(3) mlabel(state)
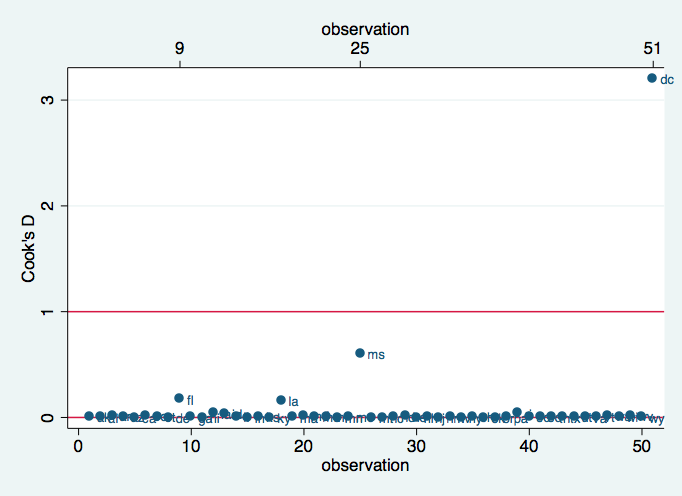
 indexplot, show(cooksd) recast(scatter) hig(3) yline(1) mlabel(state)
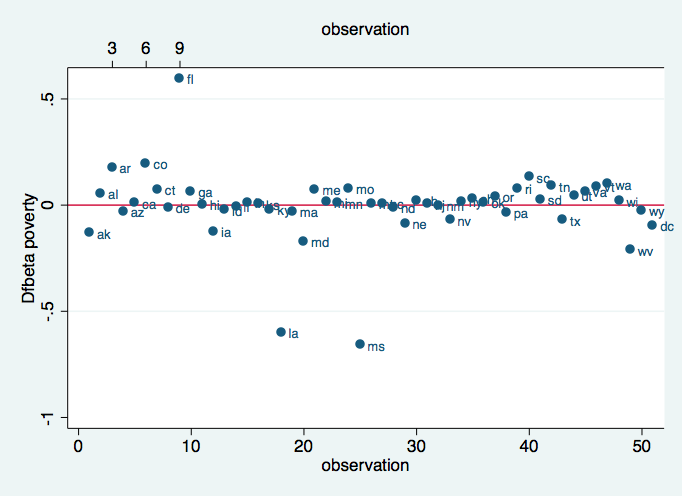
 indexplot, show(dfbeta(poverty)) recast(scatter) hig(3) mlabel(state)
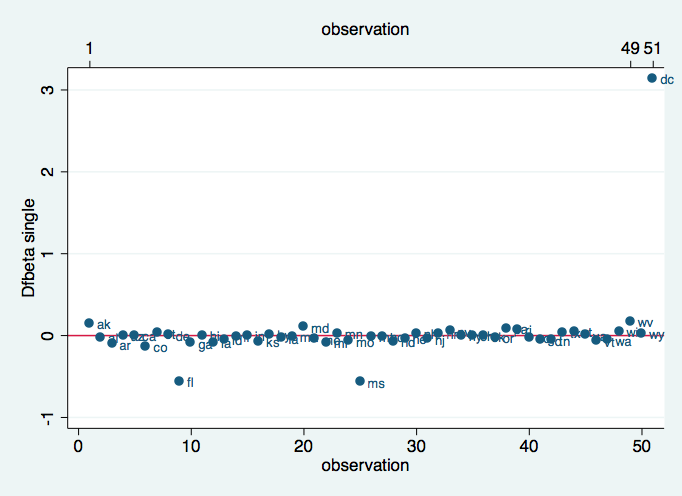
 indexplot, show(dfbeta(single)) recast(scatter) hig(3) mlabel(state)
Linear Statistical Models Course
Phil Ender, 21Jan04