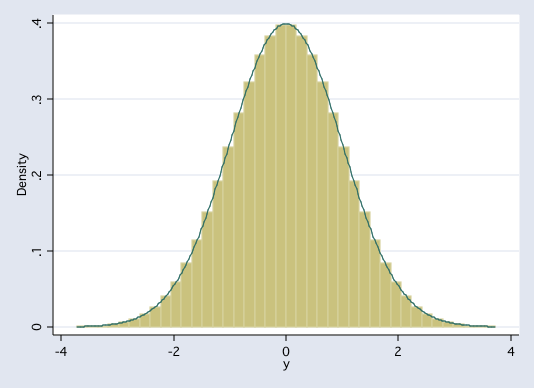
Assessing normality of a population from a sample can be rather tricky. Consider the following population of 10,000 observation.
First, I will draw nine random samples of size 200 from the population and plot their histograms.
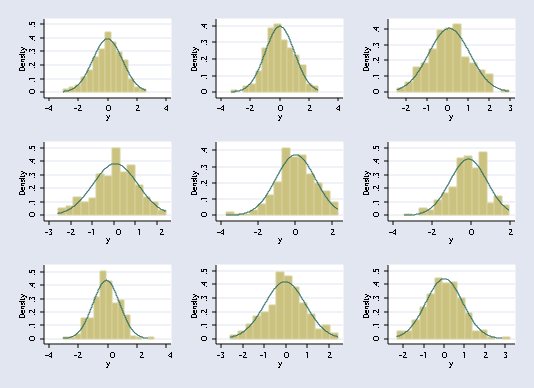
These don't look too bad. Next, I will draw nine random samples of size 20 from the population and plot their histograms.
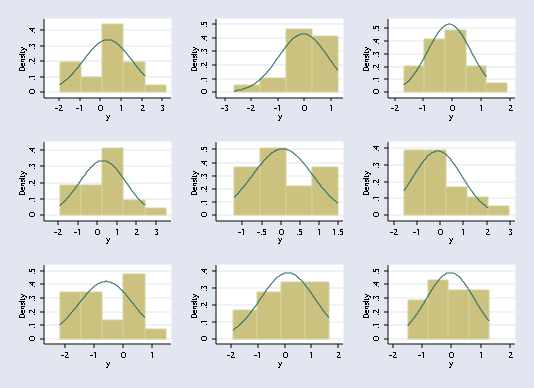
These distributions look rather suspicious. Finally, I will draw nine random samples of size 10 from the population and plot their histograms.
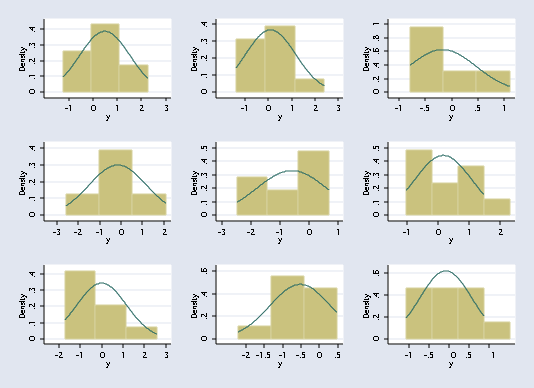
And these are even worse.
Now, we know for a fact that the population is normally distributed, however as the sample sizes get smaller and smaller it becomes increasingly difficult to assess the normality from looking at the distribution of the sample.