About Percentile Ranks
Percentile ranks or percentile scores are defined with respect to a norm or reference group.
As such, percentile
scores provide a convenient way to convey an individual's standing on a test relative to others.
An individual that scores at the 25th percentile scores above 25% of those taking the test, while
an individual that has a percentile rank score of 95 scores above 95% of the test takers.
Percentile scores represent a monotonic transformation of the underlying test scores. A monotonic transformation simply means that, if one individual's raw score is greater than another individual's raw score, the first individual's transformed score will be greater than the second individual's transformed score.
Consider this example. You give a test with 150 questions and you record the number correct for each person. Further, let's say that the distribution of correct answers follows a normal distribution. Next, you convert (transform) each of the raw scores to percentiles. Let's say that you select an individual at random whose raw score is 87. Without any other information, what do you know about this person? Very little. If I tell you that this individual's percentile score is 60, then you know that this individual scored above 60% and below 40% of the people taking the test. Thus, having a percentile rank of 60 is very nearly the same thing as having a rank of 60 out of 100.
You cannot perform the same mathematical and statistical operations on percentiles that you can on
raw scores. For example, you shouldn't compute means and standard deviations of percentile scores.
The results may be misleading. You should also know that percentile scores are not normally
distributed. Even if the raw scores follow a normal distribution, the percentiles will tend to fall
into a rectangular (uniform) distribution.
High School and Beyond Example
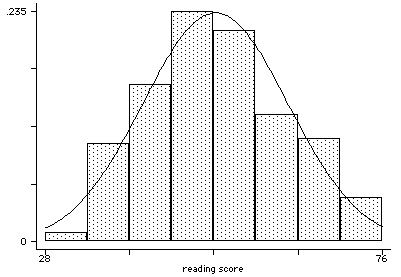
To illustrate the distribution issues related to percentiles, consider the 200 reading test scores
from the High School and Beyond dataset and plotted the histogram below. These scores may be
treated as the raw reading test scores.
Next, each of the raw reading scores are converted into percentile ranks using the formula pctrank = (rank - 0.5)/n * 100. This formula represents just one of several algorithms that can be used in determining percentiles. The raw scores and percentile ranks are shown in frequency distribution below.
   reading
     score   pctrank   Freq
       28        .25      1
       31        .75      1
       34        2.5      6
       35       4.25      1
       36       5.25      3
       37        6.5      2
       39          9      8
       41       11.5      2
       42      15.25     13
       43         19      2
       44      22.75     13
       45       26.5      2
       46      27.25      1
       47      34.25     27
       48      41.25      1
       50         46     18
       52         54     14
       53      57.75      1
       54      58.25      1
       55      61.75     13
       57       68.5     14
       60      74.25      9
       61      76.75      1
       63         81     16
       65      87.25      9
       66      89.75      1
       68      92.75     11
       71         96      2
       73      97.75      5
       76       99.5      2
Here is the histogram of the percentile scores.
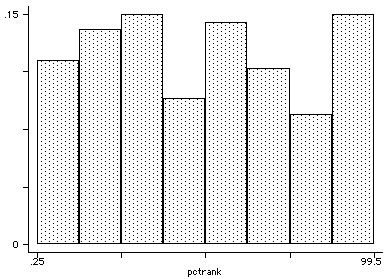
Comparing the two graphs shows that the raw reading scores were fairly normally distributed while the percentile scores fall into what is known as a rectangular or uniform distribution.
How to use Percentile Data
The dataset lahigh.dta, used in the homework assignments, originaly contained only
percentile data for CTBS Math (mathpr) and CTBS Language (langpr).
Many standardized tests distribute results to schools and parents in the form of percentile ranks,
often called national percentile ranks.
While percentile ranks are relatively easy to interpret they present problems when used in statistical
analyses. Even simple statistical computations, such as, means, standard deviations,
and histograms can be misleading when computed on percentile ranks.
To get around the problems with percentiles the ranks can be converted (transformed) into normal curve equivalent scores (NCE). NCEs are interval scaled and have normal distributions. NCE scores can be obtained as follows: nce = invnorm(pr/100)*21.06 + 50, where invnorm is the inverse normal probability function. The variables mathnce and langnce in the lahigh.dta file were created in this manner.
Imtro Home Page
Phil Ender, 30Jun98