
The normal distribution is used to test differences in means when samples are large (n > 30) or when the population variance is known. The test itself is known as a Z-test.
The principal of vocational school wants to test the hypothesis that the seniors from her school are superior in mechanical ability to seniors in general throughout the state.
H0: μ1 <= 50 H1: μ1 > 50
First, compute the standard deviation from the variance:
σ = SQRT(σ2) = SQRT(196) = 14
Next, compute the standard error of the mean
se = σ/SQRT(n) =
14/SQRT(49) = 14/7 = 2
Compute the Z-test:
Z = (Xbar - μ)/se =
(53.4 - 50)/2 = +1.7
The critical value for Z at alpha = 0.05 is +1.645
Thus, the principal concluded that the seniors at her school scored significantly higher that the state average.
Would the results have been significant if run as a two-tail test?
zdemo2 50 10 60 10
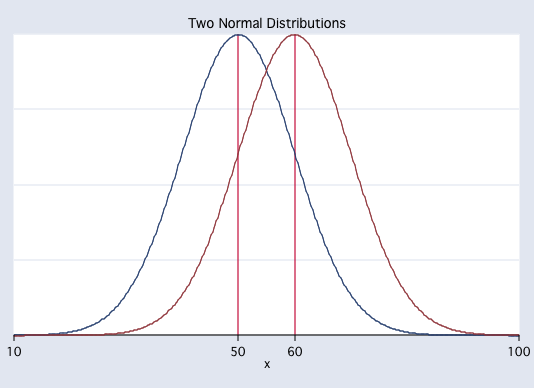
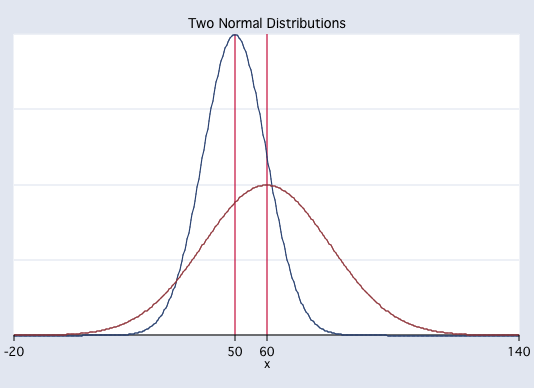
Next, there means will stay the same, 50 and 60, but the standard deviation of the second group will be increased to 20.
zdemo2 50 10 60 20
Finally, the both means will be set to 50 while the standard deviations will remain at 10 and 20.
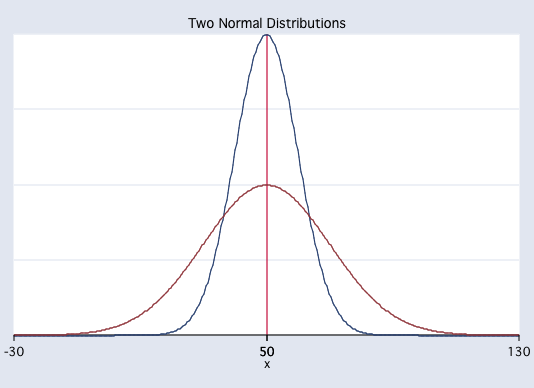
zdemo2 50 10 50 20
The following results were obtained:
| Special Ed Group | Regular Ed Group | |
|---|---|---|
| n | 36 | 36 |
| Mean | 50.4 | 47 |
| Variance | 25 | 25 |
Is there a significant difference between the two groups?
H0: μ1 = μ2 H1: μ1 ≠ μ2
First, compute the standard deviations from the variance:
σ = SQRT(σ2) =
SQRT(25) = 5 for each group
Next, computer the standard errors for each group:
se = σ/SQRT(n) =
5/SQRT(36) = 5/6 = 0.833 for each group
Compute the standard error of the differences in means:
SQRT(se21 + se22) =
SQRT(.8332 + .8332) = 1.18
Compute the Z-test:
Z = (mean1 - mean2)/sedif =
(50.4 - 47)/1.18 = +2.88
The critical value of Z is ±2.58
Thus, it is concluded that the children in the special education classes scored higher than those in the regular classes and that the difference was significant at alpha = 0.01. That is, the samples come from two different populations which have different population means.
Intro Home Page
Phil Ender, 30Jun98