
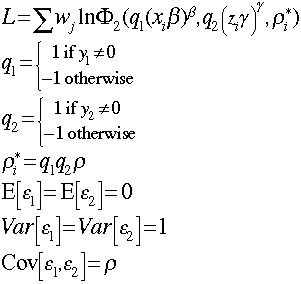
The concept of bivariate normal distibutions is very familiar to even beginning statistics students. Scatter plots and Pearson corelation are tools for examing bivariate normal distributions. Less familiar for some students might be using bivariate response variables in multivariate analyses. In the case of bivariate probit analysis we have two binary response variables that vary jointly. We want to esitmate the coefficients needed to account for this joint distribution.
As you would expect the likelihood function for bivariate probit is more complex than when there is only one esponse variable,
Example 1
use http://www.gseis.ucla.edu/courses/data/schvote, clear

probit priv years ptax inc

Probit estimates                                  Number of obs   =         80
                                                  LR chi2(3)      =       1.14
                                                  Prob > chi2     =     0.7680
Log likelihood = -29.572798                       Pseudo R2       =     0.0189

------------------------------------------------------------------------------
        priv |      Coef.   Std. Err.      z    P>|z|     [95% Conf. Interval]
-------------+----------------------------------------------------------------
       years |  -.0092045    .023364    -0.39   0.694    -.0549971    .0365882
        ptax |  -.1427311   .6937362    -0.21   0.837    -1.502429    1.216967
         inc |   .4313241   .5792655     0.74   0.457    -.7040154    1.566664
       _cons |   -4.40218   4.938369    -0.89   0.373    -14.08121    5.276846
------------------------------------------------------------------------------

probit vote years ptax inc

Probit estimates                                  Number of obs   =         80
                                                  LR chi2(3)      =      13.62
                                                  Prob > chi2     =     0.0035
Log likelihood = -45.576114                       Pseudo R2       =     0.1300

------------------------------------------------------------------------------
        vote |      Coef.   Std. Err.      z    P>|z|     [95% Conf. Interval]
-------------+----------------------------------------------------------------
       years |  -.0080101    .015893    -0.50   0.614    -.0391598    .0231395
        ptax |  -2.013629   .7192403    -2.80   0.005    -3.423314   -.6039441
         inc |   1.582937   .5671639     2.79   0.005     .4713161    2.694558
       _cons |  -1.353637   4.411823    -0.31   0.759    -10.00065    7.293378
------------------------------------------------------------------------------

biprobit priv vote years ptax inc

Bivariate probit regression                       Number of obs   =         80
                                                  Wald chi2(6)    =      11.91
Log likelihood = -74.171253                       Prob > chi2     =     0.0640

------------------------------------------------------------------------------
             |      Coef.   Std. Err.      z    P>|z|     [95% Conf. Interval]
-------------+----------------------------------------------------------------
priv         |
       years |  -.0146627   .0264275    -0.55   0.579    -.0664596    .0371342
        ptax |  -.0923143   .6922562    -0.13   0.894    -1.449112    1.264483
         inc |   .3644544   .5588324     0.65   0.514    -.7308371    1.459746
       _cons |  -4.040363   4.872994    -0.83   0.407    -13.59126    5.510529
-------------+----------------------------------------------------------------
vote         |
       years |   -.008866   .0159739    -0.56   0.579    -.0401742    .0224422
        ptax |  -2.054462   .7310168    -2.81   0.005    -3.487229   -.6216959
         inc |   1.574388   .5638432     2.79   0.005      .469276    2.679501
       _cons |  -.9732729   4.487075    -0.22   0.828    -9.767779    7.821233
-------------+----------------------------------------------------------------
     /athrho |  -.3425239   .2536544    -1.35   0.177    -.8396774    .1546297
-------------+----------------------------------------------------------------
         rho |  -.3297287   .2260769                     -.6856382    .1534089
------------------------------------------------------------------------------
Likelihood ratio test of rho=0:     chi2(1) =  1.95532    Prob > chi2 = 0.1620

test years

 ( 1)  [priv]years = 0.0
 ( 2)  [vote]years = 0.0

           chi2(  2) =    0.69
         Prob > chi2 =    0.7079


test ptax

 ( 1)  [priv]ptax = 0.0
 ( 2)  [vote]ptax = 0.0

           chi2(  2) =    8.15
         Prob > chi2 =    0.0170


test inc

 ( 1)  [priv]inc = 0.0
 ( 2)  [vote]inc = 0.0

           chi2(  2) =    8.86
         Prob > chi2 =    0.0119

mfx compute

Marginal effects after biprobit
      y  = Pr(priv=1,vote=1) (predict)
         =  .05187385
------------------------------------------------------------------------------
variable |      dy/dx    Std. Err.     z    P>|z|  [    95% C.I.   ]      X
---------+--------------------------------------------------------------------
   years |  -.0019032      .00259   -0.73   0.463  -.006986  .003179   8.77500
    ptax |   -.110602      .08091   -1.37   0.172  -.269192  .047988   6.93727
     inc |   .1141173      .06655    1.71   0.086  -.016321  .244556   9.96772
------------------------------------------------------------------------------
Example 2
use http://www.gseis.ucla.edu/courses/data/ms00, clear

describe

Contains data from http://www.gseis.ucla.edu/courses/data/ms00.dta
  obs:           200

 vars:             7                          8 Feb 2001 11:23
 size:         6,400 (99.2% of memory free)
-------------------------------------------------------------------------------
              storage  display     value
variable name   type   format      label      variable label
-------------------------------------------------------------------------------
id              float  %9.0g
female          float  %9.0g       fl
honors          float  %9.0g                  enrolled in honors
read            float  %9.0g                  reading test
write           float  %9.0g                  writing test
nss             float  %9.0g                  national science scholar
mma             float  %9.0g                  mooberry math award
-------------------------------------------------------------------------------

summarize

    Variable |     Obs        Mean   Std. Dev.       Min        Max
-------------+-----------------------------------------------------
          id |     200       100.5   57.87918          1        200
      female |     200        .545   .4992205          0          1
      honors |     200        .525   .5006277          0          1
        read |     200       52.23   10.25294         28         76
       write |     200      52.775   9.478586         31         67
         nss |     200        .165    .372112          0          1
         mma |     200        .115   .3198225          0          1

tab1 female honors

-> tabulation of female

     female |      Freq.     Percent        Cum.
------------+-----------------------------------
       male |         91       45.50       45.50
     female |        109       54.50      100.00
------------+-----------------------------------
      Total |        200      100.00

-> tabulation of honors

enrolled in |
     honors |      Freq.     Percent        Cum.
------------+-----------------------------------
          0 |         95       47.50       47.50
          1 |        105       52.50      100.00
------------+-----------------------------------
      Total |        200      100.00

tabulate nss mma

  national |
   science |  mooberry math award
   scholar |         0          1 |     Total
-----------+----------------------+----------
         0 |       155         12 |       167
         1 |        22         11 |        33
-----------+----------------------+----------
     Total |       177         23 |       200

biprobit nss mma read write honors female


Bivariate probit regression                       Number of obs   =        200
                                                  Wald chi2(8)    =      56.75
Log likelihood = -105.31311                       Prob > chi2     =     0.0000

------------------------------------------------------------------------------
             |      Coef.   Std. Err.      z    P>|z|     [95% Conf. Interval]
-------------+----------------------------------------------------------------
nss          |
        read |   .0493064   .0156631     3.15   0.002     .0186073    .0800055
       write |   .0679724   .0208136     3.27   0.001     .0271786    .1087663
      honors |  -.5517298   .2878803    -1.92   0.055    -1.115965    .0125051
      female |  -.9337984   .2767985    -3.37   0.001    -1.476313   -.3912834
       _cons |  -6.748716   1.144578    -5.90   0.000    -8.992047   -4.505385
-------------+----------------------------------------------------------------
mma          |
        read |   .0525179   .0197319     2.66   0.008     .0138441    .0911917
       write |   .1091292   .0364161     3.00   0.003      .037755    .1805034
      honors |   .8246593   .4328874     1.91   0.057    -.0237844    1.673103
      female |  -.1103348     .31435    -0.35   0.726    -.7264495    .5057799
       _cons |  -11.20763   2.338403    -4.79   0.000    -15.79081   -6.624443
-------------+----------------------------------------------------------------
     /athrho |   .3552813   .2288336     1.55   0.121    -.0932244    .8037869
-------------+----------------------------------------------------------------
         rho |   .3410509   .2022167                     -.0929552    .6661485
------------------------------------------------------------------------------
Likelihood ratio test of rho=0:     chi2(1) =  2.52696    Prob > chi2 = 0.1119

test honors

 ( 1)  [nss]honors = 0.0
 ( 2)  [mma]honors = 0.0

           chi2(  2) =    8.31
         Prob > chi2 =    0.0157


test female

 ( 1)  [nss]female = 0.0
 ( 2)  [mma]female = 0.0

           chi2(  2) =   11.41
         Prob > chi2 =    0.0033

mfx compute

Marginal effects after biprobit
      y  = Pr(nss=1,mma=1) (predict)
         =  .00303069
------------------------------------------------------------------------------
variable |      dy/dx    Std. Err.     z    P>|z|  [    95% C.I.   ]      X
---------+--------------------------------------------------------------------
    read |   .0005465      .00051    1.07   0.286  -.000457   .00155   52.2300
   write |   .0010095      .00083    1.22   0.224  -.000616  .002635   52.7750
  honors*|   .0034291      .00419    0.82   0.413  -.004778  .011636   .525000
  female*|  -.0043393      .00507   -0.86   0.392   -.01427  .005591   .545000
------------------------------------------------------------------------------
(*) dy/dx is for discrete change of dummy variable from 0 to 1
The ancillary parameter rho measures the correlation of the residuals from the two
models.
As it turns out, the two equations were not strongly associated, rho = .34, which
was not significant (chi-square = 2.53, df = 1, p =.11)Seemingly Unrelated Bivariate Probit Example
It is also possible to run biprobit as a seemlying unrelated bivariate probit in which each of the equations has different predictors. The equations are not independent since they are computed on the same set of subjects.
biprobit (nss = female write)(mma = read write)

Seemingly unrelated bivariate probit              Number of obs   =        200
                                                  Wald chi2(4)    =      50.04
Log likelihood = -113.97205                       Prob > chi2     =     0.0000

------------------------------------------------------------------------------
             |      Coef.   Std. Err.      z    P>|z|     [95% Conf. Interval]
-------------+----------------------------------------------------------------
nss          |
      female |  -1.016887   .2584353    -3.93   0.000    -1.523411   -.5103629
       write |   .0860565   .0175865     4.89   0.000     .0515876    .1205253
       _cons |  -5.273082   .9810768    -5.37   0.000    -7.195957   -3.350206
-------------+----------------------------------------------------------------
mma          |
        read |    .057744   .0199113     2.90   0.004     .0187187    .0967694
       write |   .1078431   .0345801     3.12   0.002     .0400674    .1756189
       _cons |  -10.86132   2.238518    -4.85   0.000    -15.24873   -6.473901
-------------+----------------------------------------------------------------
     /athrho |   .2028541   .2053828     0.99   0.323    -.1996887    .6053969
-------------+----------------------------------------------------------------
         rho |   .2001167   .1971579                     -.1970762    .5408787
------------------------------------------------------------------------------
Likelihood ratio test of rho=0:     chi2(1) =  .986217    Prob > chi2 = 0.3207

test write

 ( 1)  [nss]write = 0.0
 ( 2)  [mma]write = 0.0

           chi2(  2) =   32.42
         Prob > chi2 =    0.0000


test read

 ( 1)  [mma]read = 0.0

           chi2(  1) =    8.41
         Prob > chi2 =    0.0037

display "chi-square approximation = " 2.90^2

chi-square approximation = 8.41
Again it turns out that these two equations are not stongly correlated, rho = .2, which
is not statistically significant (chi-squar1 = .99, df = 1, p = .32).Instrumental Variable Example
biprobit (nss = female mma)(mma = female read write), nolog

Seemingly unrelated bivariate probit              Number of obs   =        200
                                                  Wald chi2(5)    =      90.74
Log likelihood =  -118.5046                       Prob > chi2     =     0.0000

------------------------------------------------------------------------------
             |      Coef.   Std. Err.      z    P>|z|     [95% Conf. Interval]
-------------+----------------------------------------------------------------
nss          |
      female |   -.580865   .2214549    -2.62   0.009    -1.014909   -.1468214
         mma |   2.115765   .3094269     6.84   0.000     1.509299     2.72223
       _cons |  -.9611232    .152064    -6.32   0.000    -1.259163   -.6630833
-------------+----------------------------------------------------------------
mma          |
      female |   -.222301   .3007045    -0.74   0.460     -.811671     .367069
        read |   .0675854   .0196951     3.43   0.001     .0289836    .1061871
       write |   .1076171   .0333168     3.23   0.001     .0423173    .1729168
       _cons |  -11.19188   2.087091    -5.36   0.000     -15.2825   -7.101252
-------------+----------------------------------------------------------------
     /athrho |  -1.301447   .7019475    -1.85   0.064    -2.677239    .0743445
-------------+----------------------------------------------------------------
         rho |  -.8620953   .1802543                     -.9905906    .0742078
------------------------------------------------------------------------------
Likelihood-ratio test of rho=0:     chi2(1) =  10.6787    Prob > chi2 = 0.0011
Categorical Data Analysis Course
Phil Ender